Malls · California
Fallbrook Center
Opened 1966.
Solid = from the authors' map · outlined = public source · dashed = model-written, not yet reviewed by a person. Tap any value's source label to see where it came from. documented = a quoted excerpt (click to read it) · reported = a source named, no excerpt yet · no source.
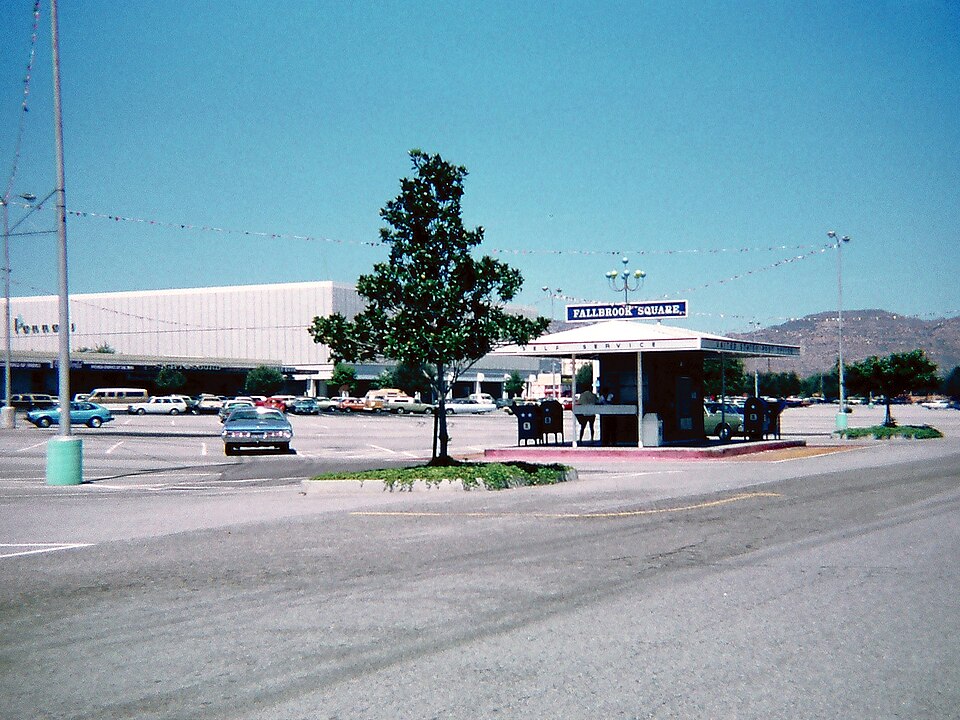
Site profile11 elements · what this retrofit is built with · tap a chip for the evidence
Closed per a 2014 list or a Wikipedia category, unchecked
This site: …closed import, no source · all sites with thisOn Facebook
This site: …https://www.facebook.com/136013979763564 overture · all sites with thisWebsite dead or redirecting
This site: …http://www.fallbrookcenter.com overture / http check · all sites with this100k+ jobs within 45 min by transit
This site: 107,335 epa-walkability · all sites with thisCounty permitting 2,000+ apartment units a year
This site: 9,430 units, Los Angeles County census-bps · all sites with thisCounty typical rent $2,000+
This site: $2,806/mo zillow · all sites with thisHigh earthquake risk
This site: Relatively High fema-nri · all sites with thisHigh-income tract ($100k+)
This site: $127,917 census-acs · all sites with thisShrinking county
This site: -2.5% census-acs · all sites with thisTract income up 60%+ since 2013
This site: +63% census-acs · all sites with thisWalkable block group (EPA ≥ 12)
This site: …index 17.2 epa-walkability · all sites with thisNow
| Status | ClosedEsri 2014 layer reported |
|---|
Securitised debt and public filers
Filings (2001 to date) that name “Fallbrook Center” and “West Hills” (41 hits, first 41 sampled, 4 other filers such as tenants left out). No commercial-mortgage trust names this mall in the sample, which does not rule out a securitised loan. Text matches, not a title search. Open the search · all trusts.
| Kind | Filer | Filings | Dates | Forms |
|---|---|---|---|---|
| Public owner (strong) | General Growth Properties, Inc. | 22 | 2011-03-01 to 2015-01-28 | 8-K 18, 10-K 4 |
| Public owner (strong) | GENERAL GROWTH PROPERTIES INC | 13 | 2002-05-13 to 2010-03-01 | 10-K 7, 10-Q 3, 8-K 2, 10-K/A 1 |
| Public owner (weak) | RETAIL OPPORTUNITY INVESTMENTS CORP (ROIC) | 4 | 2014-07-30 to 2017-09-13 | 8-K 4 |
| Public owner (weak) | Retail Opportunity Investments Partnership, LP | 4 | 2014-07-30 to 2017-09-13 | 8-K 4 |
As reported by the owner
Property tables from the owner's annual report (Form 10-K, Item 2) on EDGAR, one row per filing year. GLA, occupancy and anchors are the filer's own figures at that year end; “leased” counts signed leases, “occupied” counts open stores; ownership is the filer's share. Matched by name and place, unreviewed; the verbatim table row is in sec_facts.csv.
| Year end | Filer | Name in filing | GLA sq ft | Occupancy | Years | Share | Sales psf | Anchors listed |
|---|---|---|---|---|---|---|---|---|
| 2012 | General Growth Properties 10-K, 2013-02-28 | Fallbrook Center West Hills, CA match: exact | 875,642 | 85.2% leased | 100.0% | |||
| 2009 | General Growth Properties 10-K, 2010-03-01 | Fallbrook Center West Hills, CA match: exact | 854,095 in-line 854,095 | 24 Hour Fitness, DSW Shoe Warehouse, Home Depot, Kohl's, Macerich, Michael's, Old Navy, Party City, Petco Supplies & Fish | ||||
| 2006 | General Growth Properties 10-K, 2007-03-01 | Fallbrook Center West Hills, CA match: exact | 877,782 | 24 Hour Fitness, DSW Shoe Warehouse, Home Depot, Kohl’s, Linens ’N Things, Mervyn’s, Michael’s Arts & Crafts, Old Navy, Party City |
Site context
| Transit within 800 m | no rail station; 2 bus stops within 400 mOpenStreetMap |
|---|---|
| FEMA flood zone | no NFHL polygon at point (unmapped or outside coverage)FEMA NFHL |
| EPA-regulated facilities within 500 m | 62: 22655 CRISWELL ST; 22669 MOBILE STREET; 22676 HAMLIN ST; 22741 CRISWELL ST; 22907 VANOWEN STREET UNIT 3EPA FRS |
| Census tract 06037135201 | 2,999 people, 5,072 per sq mi; median household income $127,917; median gross rent $3,182; 11% renters; 7.0% vacant units; 1.0% commute by transitACS 2023 5-year |
| Walkability (EPA, block group) | index 17.2 of 20; 228 intersections per sq mi; nearest transit stop 178 m; land-use mix 0.72; 131,081 jobs within 45 min by car, 107,335 by transit; 11% of households without a carEPA Smart Location |
| Opportunity Zone | noHUD |
| Housing permits, Los Angeles County (CA), 2024 | 9,430 units in 5+ unit buildings, 1,273 in 2–4, 9,106 single-family; 2023: 13,214 in 5+Census BPS |
| Social vulnerability (CDC SVI 2022, tract) | overall percentile 0.59; socioeconomic 0.55; housing and transport 0.63; 17% below 150% of poverty; 7% of households with no vehicleCDC/ATSDR |
| Other atlas sites nearby | 2 within 10 km, 9 within 25 km: Westfield Topanga and The Village (2.0 km); The Promenade (2.2 km)computed |
| Overture Maps | place Fallbrook Center (shopping_mall, confidence 0.97, from Overture, meta); building footprint 11,698 m², 9.3 mOverture (CDLA-Permissive 2.0) |
| Website and social | www.fallbrookcenter.com (down or redirecting, status 405); archived 2002–2024 (Wayback) · social: facebookOverture / Internet Archive |
| Tract change 2013–2023 | population +13% (2,649 → 2,999); median income +63% ($78,472 → $127,917); renters 23% → 12%; median home value +88% ($490,600 → $921,100)Census ACS 5-year |
| Natural hazard risk (FEMA National Risk Index, tract) | relatively moderate overall (score 68.2); expected annual loss $2.6M; high: earthquake; community resilience very lowFEMA NRI |
| Tax-credit housing within 1 km | noneHUD LIHTC |
| Retail trade in the county, 2025 (BLS QCEW) | 391,331 jobs in 28,960 establishments; average annual pay $52,235; employment location quotient 0.87; employment -1.7% on the yearBLS QCEW 2025, NAICS 44-45, private |
| Jobs located in the tract, 2022 | 2,405 jobs; 1,455 in retail trade, 444 in accommodation and food (workplace blocks summed to tract 06037135201)Census LEHD LODES8 WAC 2022 |
| Upward mobility (Opportunity Atlas, 2010 tract) | children of low-income (25th percentile) families reached the 44th income percentile as adults; 0.3% incarcerated at the 2010 count (204 children in the sample); born 1978–83, measured 2014–15Opportunity Insights |
| Food access (USDA FARA 2019, 2010 tract) | not a low-access tract at 1 mile; poverty rate 6.0%; median family income $120,089; 9 SNAP householdsUSDA ERS |
| Schools | Los Angeles Unified School District (KG-12); 3 public schools within 1 mile: Hamlin Charter Academy; Welby Way Charter Elem Sch And Gifted-High Ability Magnet; Enadia Way Technology CharterNCES EDGE |
| Elevation | 831 ft above sea level at the site pointUSGS 3DEP |
| Storm events in the county, 2016-2025 | 157 county-logged events: 86 flash flood, 35 thunderstorm wind, 21 debris flow, 6 hail; $8,000 property damage reported; 1 direct deaths; forecast-zone events (most flood, winter and heat) not countedNOAA Storm Events |
| Homes for sale in ZIP 91307, 2026-09 | median list price $1,297,000 (+1.7% on the year); 75 active listings; median 54 days on market; 13% with a price cutRealtor.com Research |
| Retail trade in the county, 2012 to 2023 | 28,998 establishments (+2%); 419,890 jobs (+8%)Census CBP |
| Housing market in the county | typical home value $871,674 (+0% 1 yr, +13% 5 yr); typical rent $2,806/mo (+1% 1 yr), 2026-09Zillow Research |
| House price index, tract, 2025 | 786 (2000 = 100); +9.6% 1 yr, +47% 5 yr, +89% 10 yrFHFA |
| Traffic on the busiest road within 600 m (2024) | 27,641 vehicles a day (principal arterial, 3 lanes); 2,548 trucks; 18 counted segmentsFHWA HPMS |
Summary, model-written
Fallbrook Center opened in 1966 as a mall in West Hills, California. It operated with approximately 880,000 square feet of GLA and peaked at 42 stores. The site is currently closed.
Why. The record does not specify reasons for closure; no anchor losses, competition, debt, or demolition are mentioned.
Where it stands. The mall is listed as closed; the record does not identify the current owner or controlling entity.
For a planner
- No specific redevelopment precedents or policy tools are documented in the record.
- Open questions include future zoning, potential reuse options, and ownership clarification.
For a developer
- Site size: 880,000 sq ft GLA.
- Control and entitlement stage are not recorded in the source.
- Context layers (flood, transit, environmental constraints) are not provided.
- Market signals note a ‑2.5% county population change 2018‑23 and median rent of $1,893.
What we do not know yet
- Exact closure date and cause of closure are not recorded.
- Current owner or controlling entity is unknown.
- Environmental, flood, or transit constraints are not documented.
- The record is marked as draft with only one source, indicating thin data quality.
Generated by nvidia/nemotron-3-super-120b-a12b on NVIDIA API via Hermes CT from the fields, parcels, deals and context layers on this page, with no outside knowledge. It is regenerated when the record changes and has not been checked by a person. How it is made.
Similar sites
- Golden Mall, Burbank, CA · Malls · opened 1967; also in CA; 29 km away
- Nanuet Mall, Nanuet, NY · Malls · similar GLA (916,779 sq ft); opened 1969
- Valley Plaza, North Hollywood, CA · Malls · similar GLA (1,039,000 sq ft); also in CA; 21 km away
- Orange Plaza, Middletown, NY · Malls · similar GLA (900,000 sq ft); opened 1971
Elsewhere on the web
Retail history: Fallbrook Center on DeadMalls.com photos, field notes and visitor memories since 2000; matched by name and city; nothing copied here
Pages with photos
Search images: Google · Bing · Commons · references: ULI case studies · Google Scholar
Multifamily screen
- closed or demolished per category only, +0 until sourced
- 880,000 sq ft GLA (large site)
- county shrank -2.5% 2018–23
- median rent $1,893
Inputs: record fields (size, status) and county Census ACS 2018–2023 figures (growth, rent). How the points work. Not a recommendation.
History and original facts
| Opened | 1966Esri 2014 layer |
|---|---|
| Gross leasable area | 880,000 sq ftEsri 2014 layer reported |
| Stores at peak | 42Esri 2014 layer reported |
| Anchors | Home Depot, Mervyns, Kohl's, Target |
| Address | Fallbrook Ave. at Victory & Vanowen |
| County | Los Angeles |
| Census division | 9 · Pacific |
| Notes | Listed as a closed mall in Esri's 2014 Closed_US_Malls layer (Directory of Major Malls data). Current status to be checked. |
Not yet recorded: acres, original developer, what is there now, retrofit year. Know it? Tell us.
Timeline
- 1966 Opened
Sources
- Esri StoryMaps: Closed_US_Malls feature layer (2014) · 2014-10-02
More in California
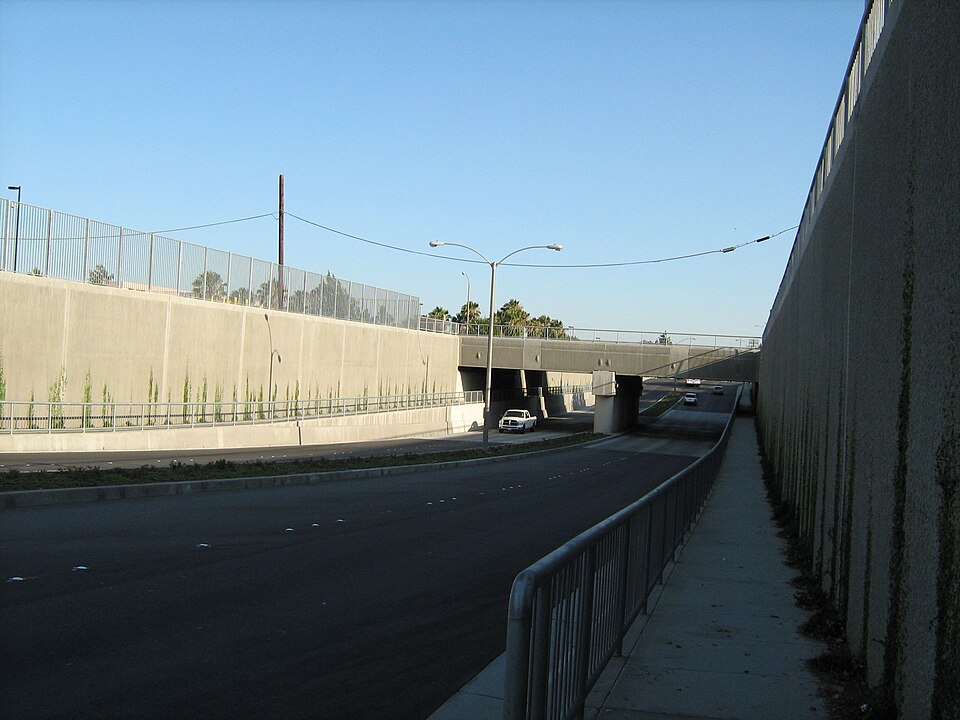 Indian Hill MallPomona, CA · 1995Reinhabited · Reinhabitation: education and office
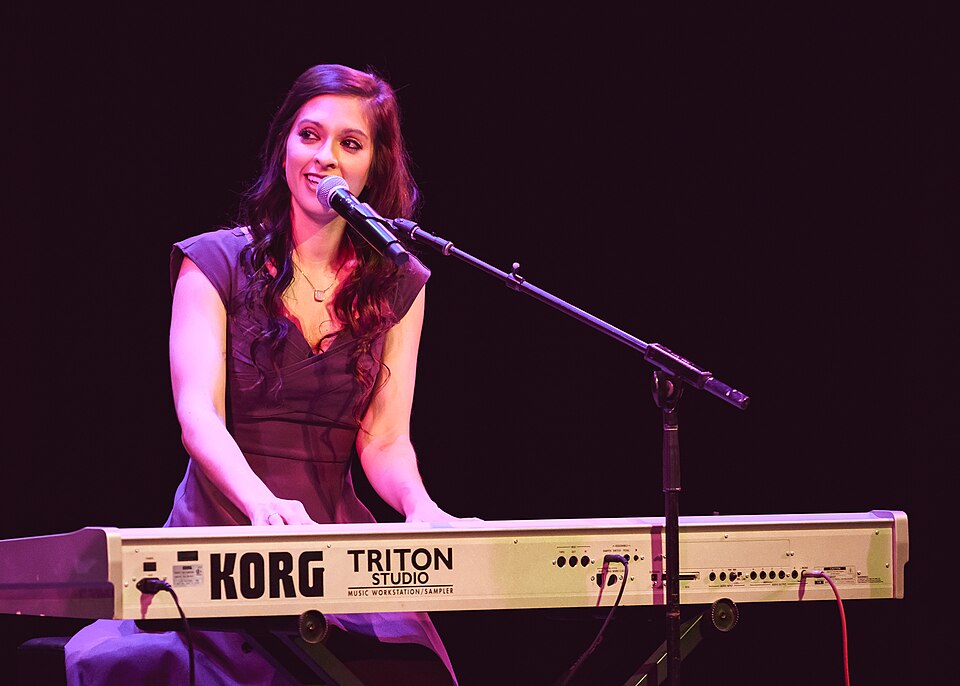 La Mirada MallLa Mirada, CA · 1990Redeveloped · Redevelopment: retail, entertainment and residential
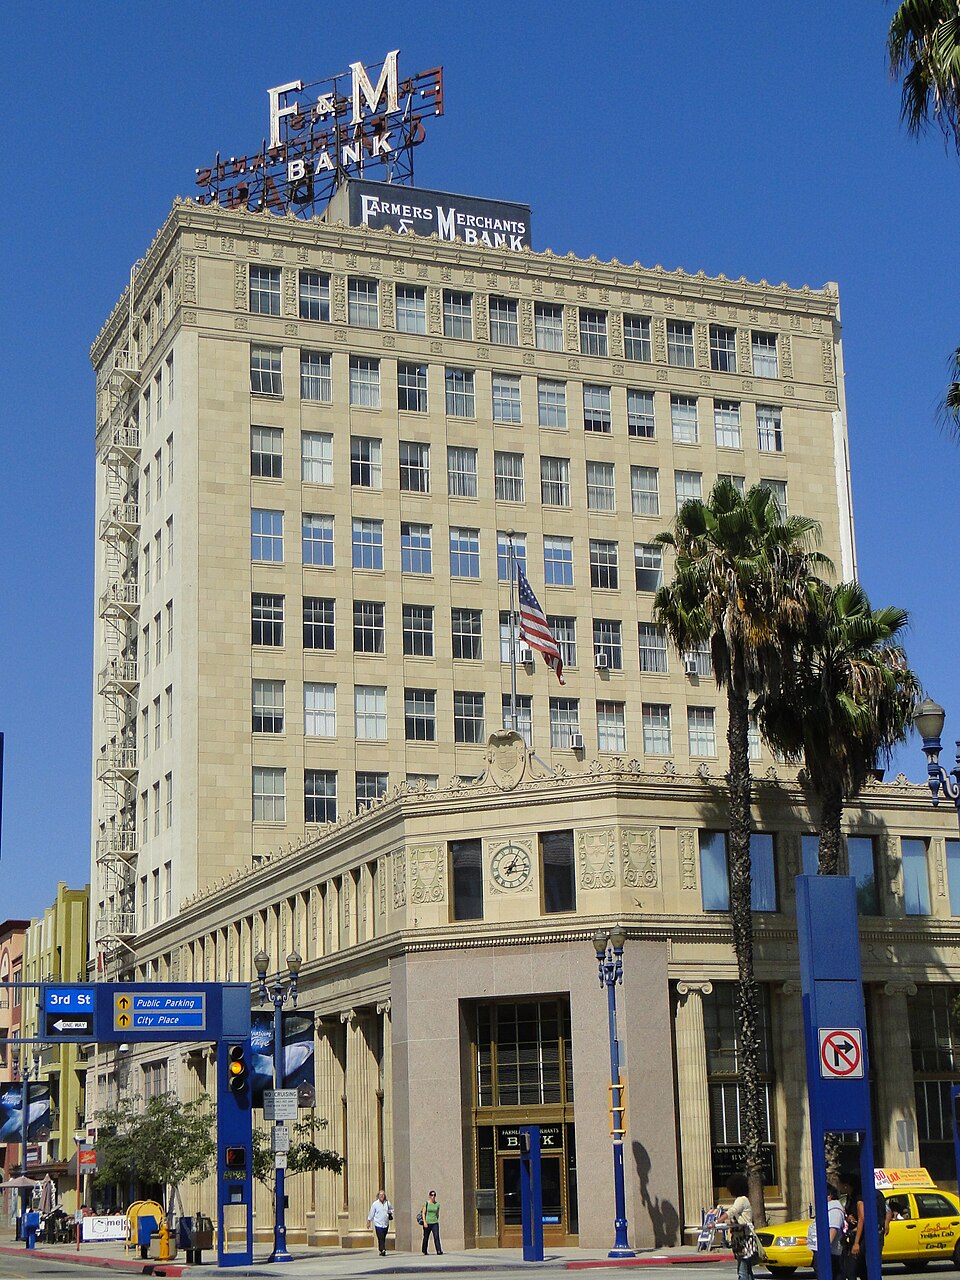 Long Beach PlazaLong Beach, CA · 2017Redeveloped · Reinhabited · Redevelopment: retail, entertainment, restored street grid Partial…
 Mayfield MallMountain View, CA · 2013Reinhabited · Reinhabitation: office