Malls · Ohio
Anderson Mall
Partial Regreened in 2003. · from the fields below
Solid = from the authors' map · outlined = public source · dashed = model-written, not yet reviewed by a person. Tap any value's source label to see where it came from. documented = a quoted excerpt (click to read it) · reported = a source named, no excerpt yet · no source.
Site profile11 elements · what this retrofit is built with · tap a chip for the evidence
15-minute neighbourhood (5+ of 6 daily needs within 800 m)
This site: 6/6 openstreetmap · all sites with thisBike network nearby
This site: 41 ways openstreetmap · all sites with thisCounty lost 10%+ of retail establishments since 2012
This site: -11% census-cbp · all sites with thisGrocery within 800 m
This site: 3 stores openstreetmap · all sites with thisHigh heat wave risk
This site: Relatively High fema-nri · all sites with thisHigh tornado risk
This site: Relatively High fema-nri · all sites with thisHigh-income tract ($100k+)
This site: $103,782 census-acs · all sites with thisLow social vulnerability tract (SVI ≤ 0.25)
This site: 0.09 cdc-svi · all sites with thisWalkable block group (EPA ≥ 12)
This site: …index 18.2 epa-walkability · all sites with thisRegreened
This site: Partial regreening, park record · all sites with thisPark and open space
This site: Partial regreening, park arcgis-webmap · all sites with thisFrom the authors' map
OH, Cincinnati: Anderson Mall, 2003
• Partial regreening, park
Now
| Status | Partly retrofittedauthors' map reported |
|---|---|
| Strategy | Partial Regreenedauthors' map reported |
| What is there now | Partial regreening, parkauthors' map reported |
| Retrofit year | 2003authors' map reported |
Securitised debt and public filers
Filings (2001 to date) that name “Anderson Mall” and “Cincinnati” (80 hits, first 80 sampled, 8 other filers such as tenants left out). No commercial-mortgage trust names this mall in the sample, which does not rule out a securitised loan. Text matches, not a title search. Open the search · all trusts.
| Kind | Filer | Filings | Dates | Forms |
|---|---|---|---|---|
| Public owner (weak) | SIMON PROPERTY GROUP INC /DE/ (SPG, SPG-PJ) | 48 | 2007-04-27 to 2014-04-22 | 8-K 32, 10-K 14, 10-K/A 2 |
| Public owner (weak) | SIMON PROPERTY GROUP L P /DE/ | 16 | 2008-03-13 to 2014-03-04 | 10-K 14, 10-K/A 2 |
Site context
| Transit within 800 m | no rail station; 3 bus stops within 400 mOpenStreetMap |
|---|---|
| Motorway junctions within 2 km | 69OpenStreetMap |
| FEMA flood zone | X · AREA OF MINIMAL FLOOD HAZARDFEMA NFHL |
| EPA-regulated facilities within 500 m | 8: BEECHMONT TOYOTA WEST; BP OIL NO 08921; CVS PHARMACY #6123; EASTSIDE BODY SHOP; ELDER BEERMANEPA FRS |
| Census tract 39061025001 | 6,915 people, 3,023 per sq mi; median household income $103,782; median gross rent $1,086; 9% renters; 0.0% vacant units; 1.1% commute by transitACS 2023 5-year |
| Walkability (EPA, block group) | index 18.2 of 20; 236 intersections per sq mi; nearest transit stop 358 m; land-use mix 0.86; 38,787 jobs within 45 min by car, 48,343 by transit; 0% of households without a carEPA Smart Location |
| Within a 10–15 minute walk (800 m) | 6 of 6 daily needs: 3 grocers, 3 schools, 25 parks or playgrounds, 4 health, 3 civic, 32 food and drink; 41 cycleway segments, 219 sidewalk-tagged segmentsOpenStreetMap |
| Opportunity Zone | noHUD |
| Housing permits, Hamilton County (OH), 2024 | 217 units in 5+ unit buildings, 39 in 2–4, 566 single-family; 2023: 654 in 5+Census BPS |
| Social vulnerability (CDC SVI 2022, tract) | overall percentile 0.09; socioeconomic 0.10; housing and transport 0.18; 6% below 150% of poverty; 1% of households with no vehicleCDC/ATSDR |
| Other atlas sites nearby | 1 within 10 km, 11 within 25 km: Beechmont Mall (0.2 km)computed |
| Overture Maps | no place match; building footprint 14,665 m², 7.432114601135254 mOverture (CDLA-Permissive 2.0) |
| Tract change 2013–2023 | population +10% (6,258 → 6,915); median income +34% ($77,379 → $103,782); renters 13% → 9%; median home value +46% ($168,400 → $246,600)Census ACS 5-year |
| Natural hazard risk (FEMA National Risk Index, tract) | relatively moderate overall (score 63.4); expected annual loss $1.7M; high: tornado, heat wave; community resilience relatively highFEMA NRI |
| Tax-credit housing within 1 km | noneHUD LIHTC |
| Retail trade in the county, 2025 (BLS QCEW) | 38,928 jobs in 2,586 establishments; average annual pay $39,344; employment location quotient 0.77; employment -1.1% on the yearBLS QCEW 2025, NAICS 44-45, private |
| Jobs located in the tract, 2022 | 2,473 jobs; 569 in retail trade, 352 in accommodation and food (workplace blocks summed to tract 39061025001)Census LEHD LODES8 WAC 2022 |
| Upward mobility (Opportunity Atlas, 2010 tract) | children of low-income (25th percentile) families reached the 46th income percentile as adults; -0.1% incarcerated at the 2010 count (307 children in the sample); born 1978–83, measured 2014–15Opportunity Insights |
| Food access (USDA FARA 2019, 2010 tract) | low-access at 1 mile, not low-income; 43% of residents more than 1 mile from a supermarket; poverty rate 6.0%; median family income $109,145; 61 SNAP householdsUSDA ERS |
| Schools | Forest Hills Local School District (PK-12); 2 public schools within 1 mile: Anderson High School; Sherwood Elementary SchoolNCES EDGE |
| Elevation | 807 ft above sea level at the site pointUSGS 3DEP |
| Storm events in the county, 2016-2025 | 324 county-logged events: 147 thunderstorm wind, 71 flash flood, 57 hail, 41 flood; $6,576,950 property damage reported; 2 direct deaths; forecast-zone events (most flood, winter and heat) not countedNOAA Storm Events |
| Homes for sale in ZIP 45255, 2026-09 | median list price $406,950 (+8.6% on the year); 31 active listings; median 34 days on market; 22% with a price cutRealtor.com Research |
| Retail trade in the county, 2012 to 2023 | 2,518 establishments (-11%); 40,920 jobs (-26%)Census CBP |
| Housing market in the county | typical home value $266,241 (+1% 1 yr, +24% 5 yr); typical rent $1,468/mo (+2% 1 yr), 2026-09Zillow Research |
| House price index, tract, 2025 | 581 (2000 = 100); +4.4% 1 yr, +53% 5 yr, +91% 10 yrFHFA |
| Traffic on the busiest road within 600 m (2024) | 29,386 vehicles a day on BEECHMONT AVE (principal arterial, 4 lanes); 305 trucks; 11 counted segmentsFHWA HPMS |
Similar sites
- Beechmont Mall, Anderson Township, OH · Malls · same strategy: regreen; also in OH; 0 km away
- Cincinnati–Blue Ash Airport, Blue Ash, OH · Other · same strategy: regreen; also in OH; 19 km away
- Highland Mall, Austin, TX · Malls · same strategy: regreen
- Midtown Plaza, Rochester, NY · Malls · same strategy: regreen
Elsewhere on the web
Pages with photos
- Space to reach your goals - POP UP SHOPS popupshops.com
- Clemson Girl: Win a $200 Anderson Mall gift card! clemsongirl.com
- andersonmall,@aladern,ndern_大山谷图库 dashangu.com
Search images: Google · Bing · Commons · references: ULI case studies · Google Scholar
Multifamily screen
- retrofit already built
Inputs: record fields (size, status) and county Census ACS 2018–2023 figures (growth, rent). How the points work. Not a recommendation.
History and original facts
| County | Hamilton County |
|---|---|
| Census division | 3 · East North Central |
Not yet recorded: acres, GLA, year opened, original developer. Know it? Tell us.
Timeline
- 2003 Retrofit: regreen
Sources
More in Ohio
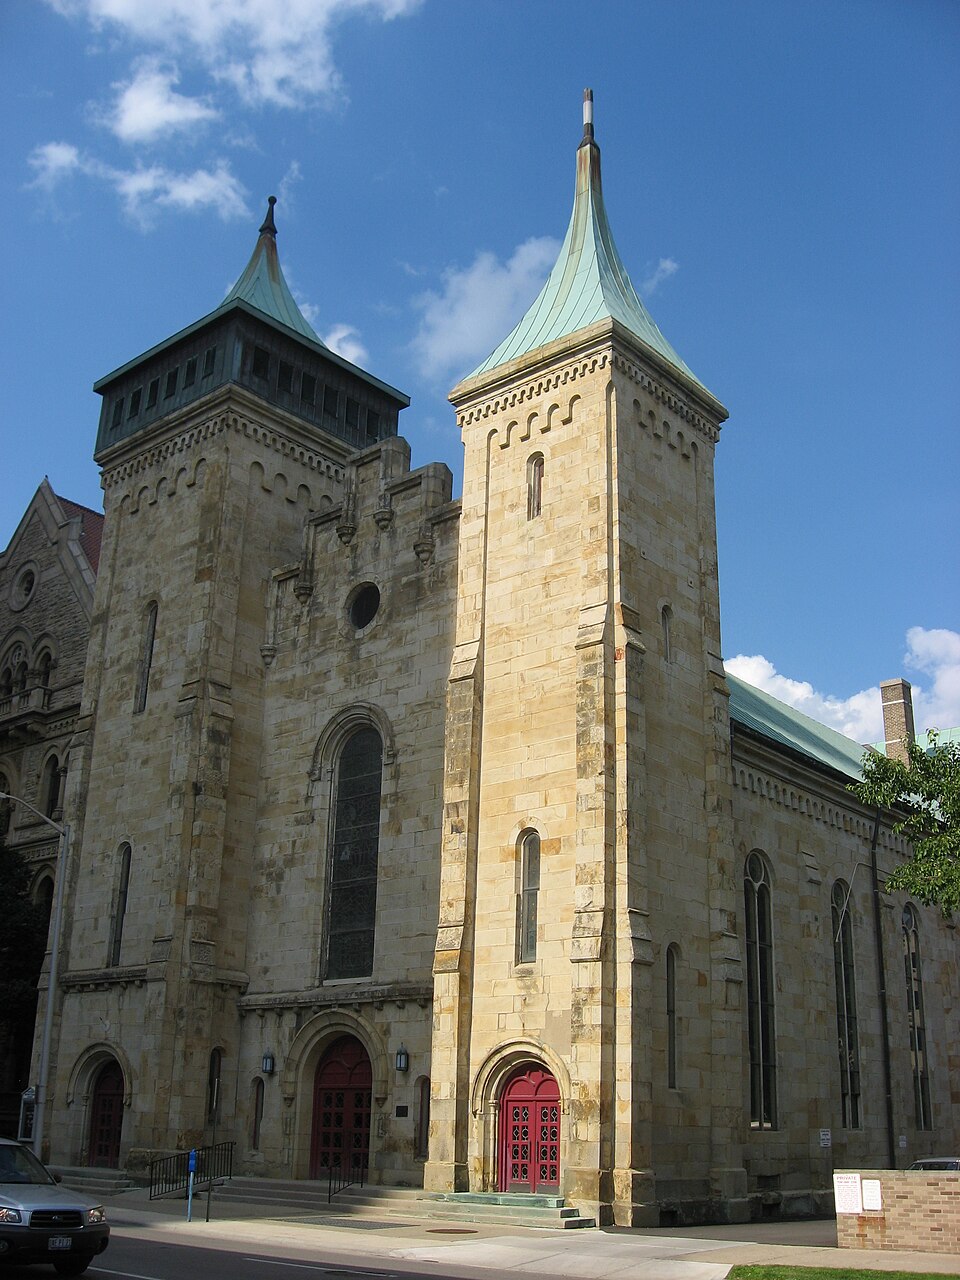 City CenterColumbus, OH · 2011Redeveloped · Regreened · Regreening: park Partial redevelopment: mixed-use residential
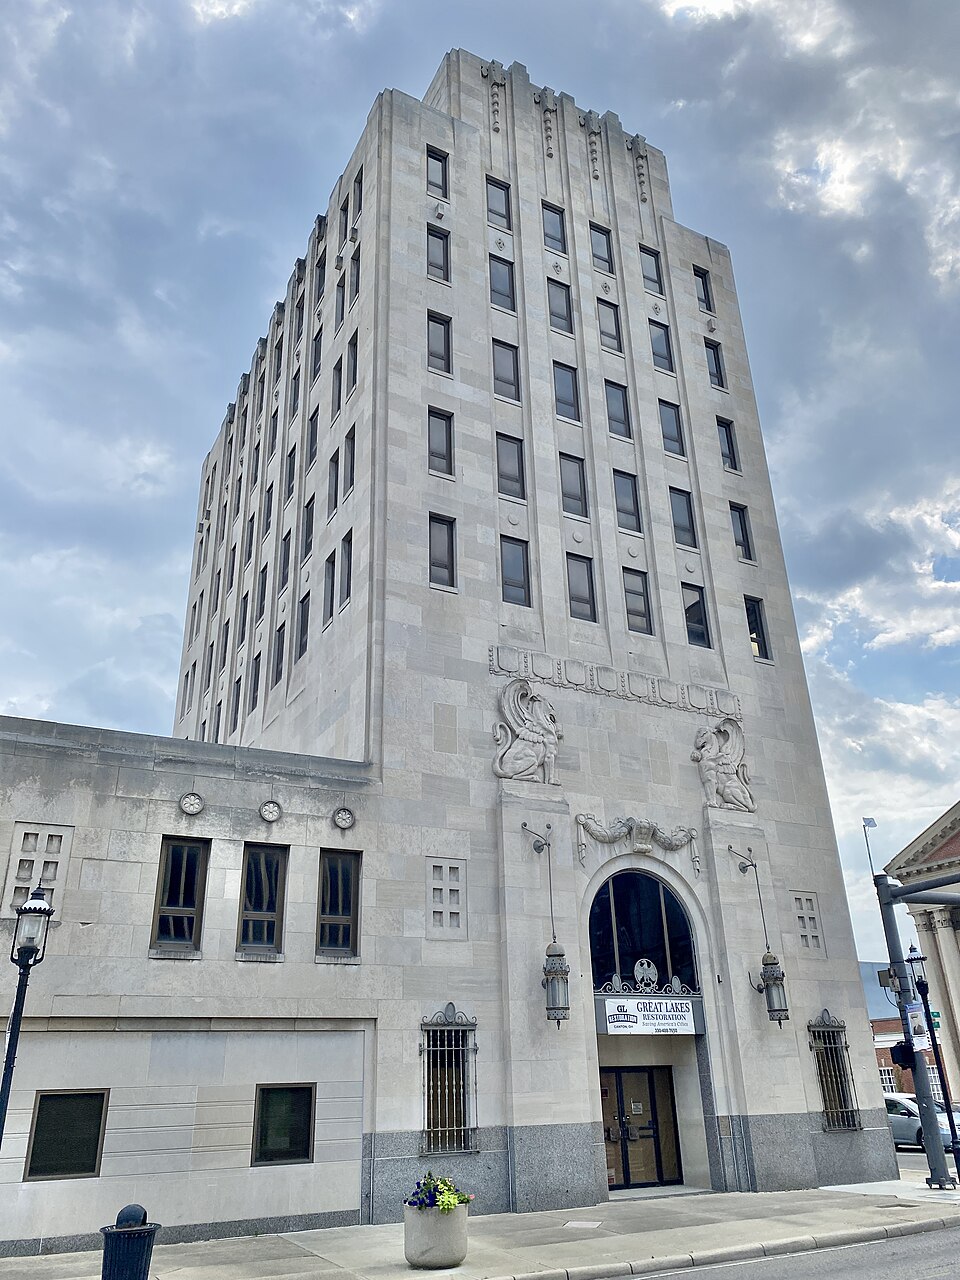 City Centre MartMiddletown, OH · 2001Redeveloped · Redevelopment: restored street grid
 Portside Festival MarketplaceToledo, OH · 1997Reinhabited · Reinhabitation: science museum
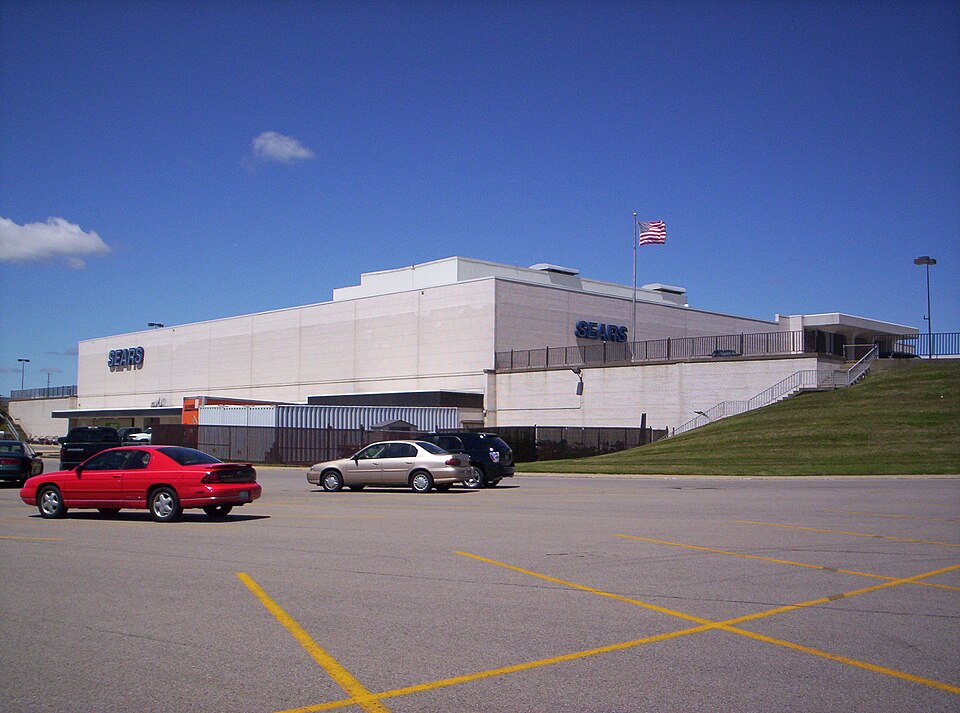 Richland MallOntario, OH · 2015Partial Reinhabited · Partial reinhabitation: healthcare195 E. Broad StreetColumbus, OHReinhabited · residential housing to the urban core